
Stéphane Roche (1) , Samira Mchinda (1) , Mathieu Santin (2) , Chloe Angelini (3, 4, 5) , Michel Bottlaender (6, 7, 8, 9) , Vincent Auboiroux (10) , Jolien van Opstal (11) , Ronald Peeters (11) , Thomas Tourdias (3, 4, 5) , Alexandre Vignaud (8) , Ludovic de Rochefort (12)
42nd annual meeting of the European Society for Magnetic Resonance in Medicine and Biology (ESMRMB), Sep 2026, Girona, Spain, France. ⟨hal-05783173⟩
- Ventio
- ICM – Institut du Cerveau = Paris Brain Institute
- Service de génétique médicale
- CHU de Bordeaux Pellegrin [Bordeaux]
- CHU de Bordeaux, Neuroimagerie diagnostique et thérapeutique, France
- Université Paris-Saclay
- CEA – CEA- Saclay
- NEUROSPIN – Service NEUROSPIN
- UNIACT – Unité de recherche en NeuroImagerie Applicative Clinique et Translationnelle
- CEA-LETI – Commissariat à l’énergie atomique et aux énergies alternatives – Laboratoire d’Electronique et de Technologie de l’Information
- UZ Leuven – Universitair Ziekenhuis Leuven = University Hospital of Leuven = Hopital universitaire de Louvain
- CRMBM – Centre de résonance magnétique biologique et médicale
Introduction: MRI is central for the diagnostic and monitoring of multiple sclerosis (MS) by detecting lesion type, location, and evolution. Since the 2024 McDonald 1 revisions, there is a need for enhanced visualisation and quantification of susceptibility-based imaging biomarkers such as the paramagnetic rim lesion and the central vein sign. Despite qualitative clinical techniques such as SWI 2 and filtered phase imaging 3, quantitative research approaches such as QSM 4, which may bring objectivity, are still suboptimal in terms of image quality and spatial coverage. Here, a new method is shown to fully exploit magnitude and phase data in gradient-echo scans providing clinically robust whole-head susceptibility qualitative and quantitative contrasts.
Methods: A retrospective multicenter study (France, Belgium, USA) was conducted using 3D multi-echo GRE sequences (Table 1). Data included 5 healthy controls (female and male, 40–75 years) and 4 female MS patients (40–60 years, stable disease), followed over 6–40 months with 2–6 repeated scans. Imaging was performed across multiple MRI systems (1.5T, 3T, and 7T) and manufacturers (Siemens, Philips, GE), with the optimization phase conducted in healthy controls to refine processing methods. The optimized method was then applied to MS patients, with the addition of FLAIR imaging to provide lesion reference and characterization. Magnitude data were corrected to isolate T2* and anatomical contrasts, while phase data were processed with a dedicated and robust strategy to provide whole-head enhanced susceptibility contrasts. Phase unwrapping and background field removal were performed using a Laplacian-based approach. Magnetic susceptibility was then estimated using a constrained least-squares (maximum likelihood) formulation with zeroth- and second-order priors and will be referred as to Enhanced Susceptibility Mapping (ESM).
Results: The method ensures robustness and reproducibility across MRI manufacturers and field strengths (figure 1), enabling enhanced susceptibility imaging with extended spatial coverage in clinical settings. It is compatible with multi-echo acquisitions and further produces co-localised R2*, T2*-weighted (corrected from T1 and bias field), anatomical with attenuated CSF signals, enhanced susceptibility mapping without anatomical masking (figure 2). It is resilient to air–bone interfaces and improves accuracy and reproducibility. Key MS biomarkers, including paramagnetic rims and central veins sign, are reliably detected, along with venous structures and calcifications. Longitudinal analysis confirms reproducibility and enables detailed visualisation of brain tissues and lesion evolution (figure 3).
Conclusion: This enhanced susceptibility mapping (ESM) approach enables whole-head exploration of susceptibility quantification. ESM supports robust tissue characterisation without anatomic masking, discrimination of para- and diamagnetic sources, and longitudinal assessment of lesion progression in MS. From multi-GRE data, it was further generated multiple quantitative maps and contrasts (R2*, T2* weighted corrected from T1 and bias field, anatomical information with attenuated CSF signals) from a single acquisition, providing co-localised valuable magnitude-based images for radiological review.
Data and Code Availability Statement: Owing to contractual constraints, the raw data underlying this study cannot be made publicly available; additionally, the associated code implements a proprietary methodology that is currently the subject of a pending patent application.
Project funded by the “Sud” region and by the government as part of the France 2030 investments for the future plan and operated by BPIFrance.
References:
- Montalban et al., “Diagnosis of multiple sclerosis: 2024 revisions of the McDonald criteria”, Lancet Neurology, 2025, doi: 10.1016/S1474-4422(25)00270-4
- EM Haacke et al., “Susceptibility-Weighted Imaging: Technical Aspects and Clinical Applications”, AJNR, 2009, doi: 10.3174/ajnr.A1400
- Wymmer et al., “Phase-Contrast MRI: Physics, Techniques, and Clinical Applications”, RSNA, 2020, doi: 10.1148/rg.2020190039
- de ROCHEFORT et al, “Quantitative susceptibility map reconstruction from MR phase data using bayesian regularization: validation and application to brain imaging”, MRM, 2010, doi : 10.1002/mrm.22187
- de ROCHEFORT et al, “Quantitative Susceptibility Mapping in Vivo in the Rat Brain”, Annual meeting ISMRM-ESMRMB, 2010, #4997
| Subject | Manufacturer | Magnetic Field | Echo train length | TR | TE1 | last TE | Flip Angle | Resolution (isotropic) |
| CTRL1 | Siemens | 1.5T | 7 | 52ms | 6ms | 42ms | 22° | 0.84mm* |
| CTRL2 | Siemens | 3T | 12 | 38ms | 3ms | 36ms | 15° | 1mm |
| CTRL3 | Siemens | 7T | 10 | 37ms | 1.68ms | 29.1ms | 30° | 0.8mm |
| CTRL4 | GE | 3T | 6 | 34.7ms | 4.34ms | 29.38ms | 16.3° | 1mm |
| CTRL5 | Philips | 3T | 7 | 35ms | 3.51ms | 26.8ms | 15° | 1mm |
| MS1-MS4 | Siemens | 3T | 6 | 46ms | 6.15ms | 40.4ms | 20° | 0.8mm |
Table 1: Characteristics of multi-echo gradient-echo acquisitions for the control scans (CTRL) as well as for the 4 MS patients (MS1-MS4). *Interpolated by factor 2.
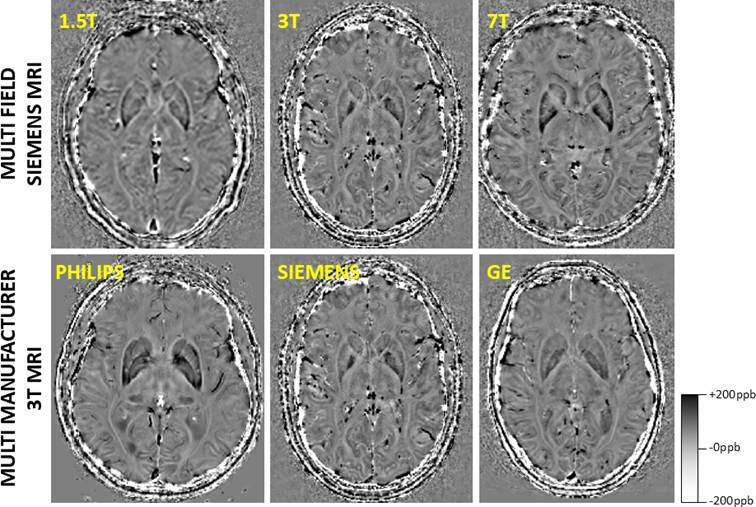
Figure 1: Multi-manufacturer and multi-field assessment of the proposed enhanced susceptibility mapping (ESM) in control subjects. The proposed approach delivers consistent, high-resolution contrasts across different MRI systems and field strengths, supporting robust, reproducible, and standardised ESM. The chosen convention is to represent diamagnetic in white (-200 parts-per-billion) and paramagnetic in black (+200 parts-per-billion).