Quantitative Susceptibility Mapping (QSM), a biomedical imaging technology with multiple applications for brain research
Dr. Stephane ROCHE, PhD, Dr. Ludovic de ROCHEFORT, PhD; Novembre 2022
Definition: QSM (Quantitative Susceptibility Mapping) is an advanced biomedical imaging technique for research, based on Magnetic Resonance Imaging (MRI) 1,2. The QSM technology identifies the position and intensity of magnetic sources in tissues, based on MRI magnetic field mapping. QSM technology is therefore non-invasive and has the same limitations as any MRI examination. In the biomedical imaging workflow of your research, this examination may sometimes require a few extra minutes in the MRI machine. Therefore, this QSM technique is used mainly for brain imaging in preclinical and clinical research protocols to provide complementary measurements to standard imaging.
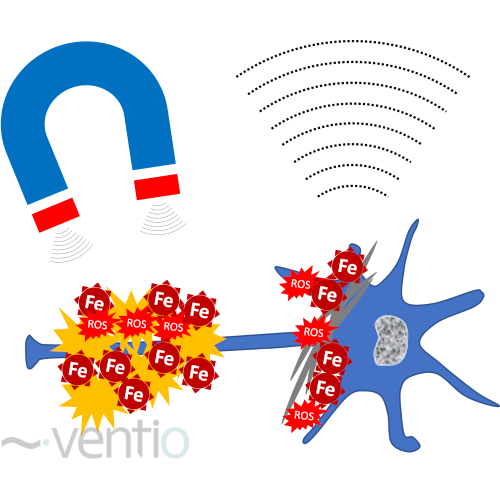
Figure 1: Quantification of toxic accumulation of iron nanocrystals by magnetic susceptibility quantification (QSM)
Scientific rationale: This technology allows the detection of iron accumulations in the brain (figure 1). Iron is the most abundant metal on earth and is present in the body in both its Fe(II) and Fe(III) ionic states, in free and oxide form, and is involved in many physiological mechanisms such as oxygen transport in hemoglobin, energy metabolism, DNA synthesis, neurotransmitter production & regulation and others enzymatic processes. Intracerebral iron is also involved in the formation and maintenance of neural networks 3–5 and is essential for the formation and repair of the myelin sheath 6–10.
Abnormal iron accumulation is toxic, causing free radical formation and oxidative stress inducing neuronal death, without going through apoptosis mechanism. This iron-induced cell death has been named ferroptosis 11–13. The toxic accumulation of iron nanocrystals, combined with ferritin structure, have a size around 10nm 14,15. These nanocrystals have a pseudo-enzymatic activity producing reactive oxygen species 16–19.
biophysic rationale: The accumulation of iron in nanocrystals form is accompanied by a magnetism change of the associated iron oxides. The labile ionic forms of iron, involved in normal physiology, are weakly detectable by MRI. On the other hand, iron accumulations in oxide form are, in some cases, paramagnetics 20,21, modify the surrounding magnetic field and induce strong local magnetic effects, characterized by a change in the capacity to magnetise (magnetic susceptibility). The QSM technology makes it possible to detect these effects, position them and quantify the signals related to magnetic susceptibility, particularly at the brain level (figure 2).
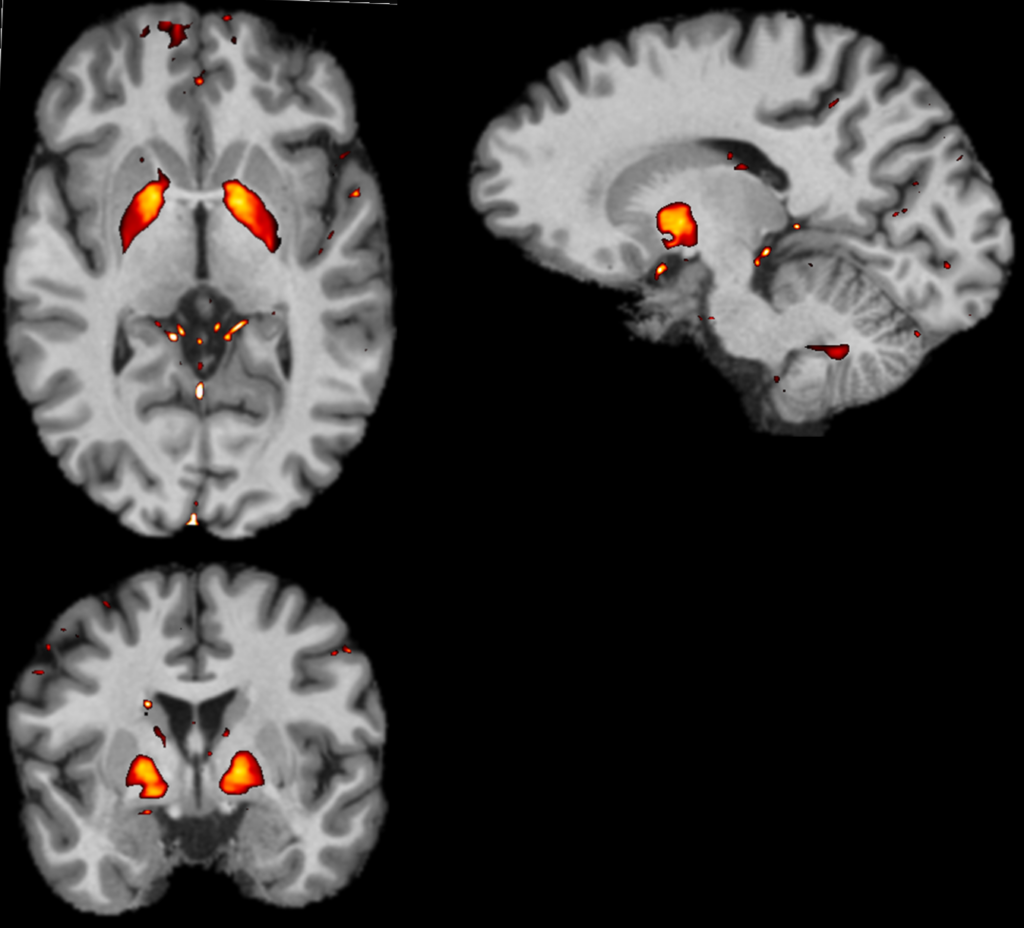
Figure 2: Axial, sagittal and coronal sections of the brain by MRI and superposition of QSM signals (Courtesy of CRMBM/CNRS UMR7339)
This technology, initially proposed by Cornell University 22,23 have been co-invented by the founder of Ventio, exclusive distributor of QSMetric for research in Europe in Software-as-a-Service (SaaS) mode. This technology has undergone significant scientific and technical development, enabling it to be used independently of the MRI machine, to be robust in multicentric studies 24–28 and can be applied to MRI from 1.5T to 7T 26,29–31. To be optimal, the technology requires the addition of a specific T2* 3D multi-echo GRE sequence, similar to a susceptibility weighted imaging (SWI) sequence 32, and in which the phase images are to be acquired and stored in order to perform the reconstruction of the QSM images.
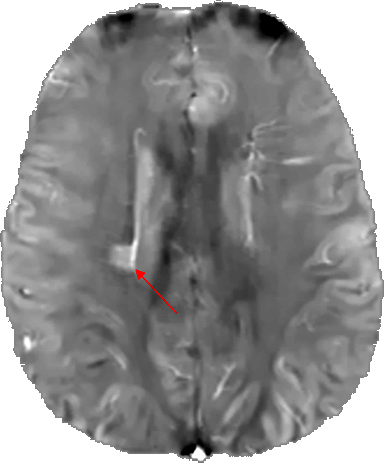
Figure 3: QSM brain image (axial slice) of a patient with multiple sclerosis. The red arrow indicates the lesion. (Courtesy of MIM – MedImageMetric LLC)
Biomedical rational: There is a strong scientific rationale between iron accumulation, brain ageing and the development of neurodegenerative diseases 33. Iron accumulations in damaged areas of the brain are associated with toxic accumulation of proteins, such as the deposition of Aβ peptides and Tau / phosphoTau proteins in Alzheimer’s disease 34–36, the accumulation of α-synuclein in Parkinson’s disease and related dementias (Lewy body dementia) 37–39 or huntingtin accumulation in Huntington’s disease 40–42. Abnormal iron distributions are also found in diseases such as multiple sclerosis, in particular co-located with white matter lesions, potentially linked to a more or less marked cognitive decline 43.
The change in iron distribution visualized by MRI and QSM is also observed in vascular dementia 44 and is being studied in oncological pathologies 45. Large, high-potential population studies using QSM to develop predictive biomarkers show the maturity of this technology 46. Interestingly, a clinical study on brain damage related to the neuropsychiatric consequences of long CoViD-19 demonstrate the potential of MRI with the QSM technology, especially for its multicentric robustness 47.
QSMetric’s competitive advantages: The patented QSM technology is widely adopted by the MRI scientific community with a steady increase in scientific publications per year. It has helped to answer a number of questions encountered in clinical research projects. The results are independent of the manufacturer of the MRI machine, so it is adaptable to all centers in multicentric studies. It is applicable to standard 1.5 and 3T machines, but also to 7T ultra-high field machines 24,31. Results on 3 Tesla (3T) devices are very robust and reproducible 25,26,29. QSMetric technology has a FDA-clearance for premarket authorization in the USA 48.
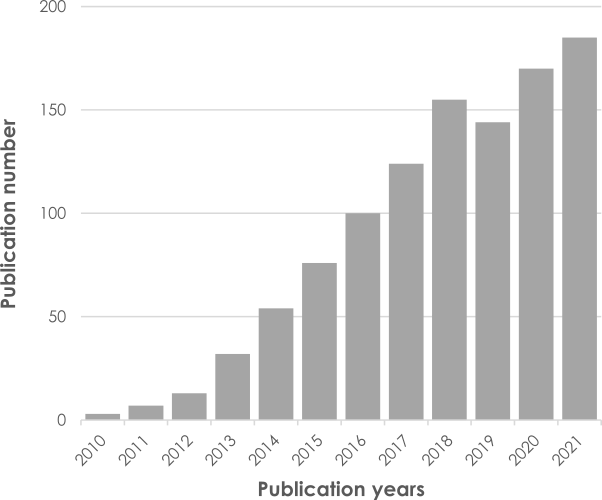
Figure 4: Adoption by the scientific community of the QSM technology and increase in the annual frequency of publications in PubMed with the keywords “Quantitative Susceptibility Mapping”.
In Europe, this technology is deployed by the company Ventio, which offers licenses in SaaS mode for research applications. It is an innovative advanced processing to be integrated into multicentric studies alongside more traditional biomarkers. Our team is currently working to create research partnerships on the applications of this technology.
The biomedical imaging technology QSM (Quantitative Susceptibility Mapping) is a robust and quantitative biomarker of intracerebral iron and can significantly increase the competitiveness of research studies about ferroptosis and the related neurodegenerative mechanisms. The QSMetric technology distributed by Ventio is reproducible, multi-field, multi-manufacturer, and therefore ideal for your multicentric studies. Thanks to its SaaS mode on a secure cloud, the technology can be interfaced to process data from cohorts already constituted or in the process of being constituted
Contact us for a commercial offer or a partnership!
Bibliography
- Wang, Y., de Rochefort, L., Liu, T. & Kressler, B. Magnetic source MRI: a new quantitative imaging of magnetic biomarkers. Annu. Int. Conf. IEEE Eng. Med. Biol. Soc. IEEE Eng. Med. Biol. Soc. Annu. Int. Conf. 2009, 53–56 (2009).
- de Rochefort, L. et al. Quantitative susceptibility map reconstruction from MR phase data using bayesian regularization: validation and application to brain imaging. Magn. Reson. Med. 63, 194–206 (2010).
- Cecilia, A. et al. Cognitive control inhibition networks in adulthood are impaired by early iron deficiency in infancy. NeuroImage Clin. 35, 103089 (2022).
- Vallée, L. Fer et neurodéveloppement. Arch. Pédiatrie 24, 5S18-5S22 (2017).
- Georgieff, M. K. The role of iron in neurodevelopment: fetal iron deficiency and the developing hippocampus. Biochem. Soc. Trans. 36, 1267–1271 (2008).
- Shin, J. A. et al. Iron released from reactive microglia by noggin improves myelin repair in the ischemic brain. Neuropharmacology 133, 202–215 (2018).
- Cheli, V. T. et al. H-ferritin expression in astrocytes is necessary for proper oligodendrocyte development and myelination. Glia 69, 2981–2998 (2021).
- Mietto, B. S., Jhelum, P., Schulz, K. & David, S. Schwann Cells Provide Iron to Axonal Mitochondria and Its Role in Nerve Regeneration. J. Neurosci. 41, 7300–7313 (2021).
- Wan, R. et al. Impaired Postnatal Myelination in a Conditional Knockout Mouse for the Ferritin Heavy Chain in Oligodendroglial Cells. J. Neurosci. 40, 7609–7624 (2020).
- Lee, N. J. et al. Potential role of iron in repair of inflammatory demyelinating lesions. J. Clin. Invest. 129, 4365–4376 (2019).
- Dixon, S. J. et al. Ferroptosis: an iron-dependent form of nonapoptotic cell death. Cell 149, 1060–1072 (2012).
- Masaldan, S., Bush, A. I., Devos, D., Rolland, A. S. & Moreau, C. Striking while the iron is hot: Iron metabolism and ferroptosis in neurodegeneration. Free Radic. Biol. Med. 133, 221–233 (2019).
- Yan, H. et al. Ferroptosis: mechanisms and links with diseases. Signal Transduct. Target. Ther. 6, 1–16 (2021).
- Alekseenko, A. V., Waseem, T. V. & Fedorovich, S. V. Ferritin, a protein containing iron nanoparticles, induces reactive oxygen species formation and inhibits glutamate uptake in rat brain synaptosomes. Brain Res. 1241, 193–200 (2008).
- Theil, E. C., Matzapetakis, M. & Liu, X. Ferritins: iron/oxygen biominerals in protein nanocages. JBIC J. Biol. Inorg. Chem. 11, 803–810 (2006).
- Honarmand Ebrahimi, K., Bill, E., Hagedoorn, P.-L. & Hagen, W. R. The catalytic center of ferritin regulates iron storage via Fe(II)-Fe(III) displacement. Nat. Chem. Biol. 8, 941–948 (2012).
- Honarmand Ebrahimi, K., Hagedoorn, P.-L. & Hagen, W. R. Unity in the biochemistry of the iron-storage proteins ferritin and bacterioferritin. Chem. Rev. 115, 295–326 (2015).
- Watt, R. K. A unified model for ferritin iron loading by the catalytic center: implications for controlling ‘free iron’ during oxidative stress. Chembiochem Eur. J. Chem. Biol. 14, 415–419 (2013).
- Gao, L., Fan, K. & Yan, X. Iron Oxide Nanozyme: A Multifunctional Enzyme Mimetic for Biomedical Applications. Theranostics 7, 3207–3227 (2017).
- Svobodova, H. et al. Iron-oxide minerals in the human tissues. Biometals Int. J. Role Met. Ions Biol. Biochem. Med. 33, 1–13 (2020).
- Vroegindeweij, L. H. P. et al. Quantification of different iron forms in the aceruloplasminemia brain to explore iron-related neurodegeneration. NeuroImage Clin. 30, 102657 (2021).
- de Rochefort, L. et al. Quantitative susceptibility map reconstruction from MR phase data using bayesian regularization: validation and application to brain imaging. Magn. Reson. Med. 63, 194–206 (2010).
- de Rochefort, L., Brown, R., Prince, M. R. & Wang, Y. Quantitative MR susceptibility mapping using piece-wise constant regularized inversion of the magnetic field. Magn. Reson. Med. 60, 1003–1009 (2008).
- Spincemaille, P. et al. Clinical Integration of Automated Processing for Brain Quantitative Susceptibility Mapping: Multi-Site Reproducibility and Single-Site Robustness. J. Neuroimaging Off. J. Am. Soc. Neuroimaging 29, 689–698 (2019).
- Lancione, M. et al. Multi-centre and multi-vendor reproducibility of a standardized protocol for quantitative susceptibility Mapping of the human brain at 3T. Phys. Med. 103, 37–45 (2022).
- Deh, K. et al. Multicenter reproducibility of quantitative susceptibility mapping in a gadolinium phantom using MEDI+0 automatic zero referencing. Magn. Reson. Med. 81, 1229–1236 (2019).
- Rua, C. et al. Multi-centre, multi-vendor reproducibility of 7T QSM and R2* in the human brain: Results from the UK7T study. NeuroImage 223, 117358 (2020).
- Lancione, M. et al. Echo-time dependency of quantitative susceptibility mapping reproducibility at different magnetic field strengths. NeuroImage 197, 557–564 (2019).
- Deh, K. et al. Reproducibility of quantitative susceptibility mapping in the brain at two field strengths from two vendors. J. Magn. Reson. Imaging 42, 1592–1600 (2015).
- Ippoliti, M. et al. Quantitative susceptibility mapping across two clinical field strengths: Contrast-to-noise ratio enhancement at 1.5T. J. Magn. Reson. Imaging JMRI 48, 1410–1420 (2018).
- Spincemaille, P. et al. Quantitative Susceptibility Mapping: MRI at 7T versus 3T. J. Neuroimaging Off. J. Am. Soc. Neuroimaging 30, 65–75 (2020).
- Bian, W. et al. MR susceptibility contrast imaging using a 2D simultaneous multi-slice gradient-echo sequence at 7T. PLOS ONE 14, e0219705 (2019).
- Ravanfar, P. et al. Systematic Review: Quantitative Susceptibility Mapping (QSM) of Brain Iron Profile in Neurodegenerative Diseases. Front. Neurosci. 15, 618435 (2021).
- Ayton, S. et al. Brain iron is associated with accelerated cognitive decline in people with Alzheimer pathology. Mol. Psychiatry 25, 2932–2941 (2020).
- Cogswell, P. M. et al. Associations of quantitative susceptibility mapping with Alzheimer’s disease clinical and imaging markers. NeuroImage 224, 117433 (2021).
- Kim, H.-G. et al. Evaluation and Prediction of Early Alzheimer’s Disease Using a Machine Learning-based Optimized Combination-Feature Set on Gray Matter Volume and Quantitative Susceptibility Mapping. Curr. Alzheimer Res. 17, 428–437.
- Duce, J. A. et al. Post translational changes to α-synuclein control iron and dopamine trafficking; a concept for neuron vulnerability in Parkinson’s disease. Mol. Neurodegener. 12, 45 (2017).
- Du, G. et al. Distinct progression pattern of susceptibility MRI in the substantia nigra of Parkinson’s patients. Mov. Disord. 33, 1423–1431 (2018).
- Thomas, G. E. C. et al. Brain iron deposition is linked with cognitive severity in Parkinson’s disease. J. Neurol. Neurosurg. Psychiatry 91, 418–425 (2020).
- van Bergen, J. M. G. et al. Quantitative Susceptibility Mapping Suggests Altered Brain Iron in Premanifest Huntington Disease. Am. J. Neuroradiol. 37, 789–796 (2016).
- Kinnunen, K. M. et al. Volumetric MRI-Based Biomarkers in Huntington’s Disease: An Evidentiary Review. Front. Neurol. 12, 712555 (2021).
- Lavrador, R., Júlio, F., Januário, C., Castelo-Branco, M. & Caetano, G. Classification of Huntington’s Disease Stage with Features Derived from Structural and Diffusion-Weighted Imaging. J. Pers. Med. 12, 704 (2022).
- Huang, W. et al. Quantitative susceptibility mapping captures chronic multiple sclerosis rim lesions with greater myelin damage: Comparison with high-pass filtered phase MRI. http://medrxiv.org/lookup/doi/10.1101/2021.05.23.21257680 (2021) doi:10.1101/2021.05.23.21257680.
- Moon, Y., Han, S.-H. & Moon, W.-J. Patterns of Brain Iron Accumulation in Vascular Dementia and Alzheimer’s Dementia Using Quantitative Susceptibility Mapping Imaging. J. Alzheimers Dis. 51, 737–745 (2016).
- Reith, T. P. et al. Basal Ganglia Iron Content Increases with Glioma Severity Using Quantitative Susceptibility Mapping: A Potential Biomarker of Tumor Severity. Tomography 8, 789–797 (2022).
- Wang, C. et al. Phenotypic and genetic associations of quantitative magnetic susceptibility in UK Biobank brain imaging. Nat. Neurosci. 25, 818–831 (2022).
- Duff, E. et al. Reliability of multi-site UK Biobank MRI brain phenotypes for the assessment of neuropsychiatric complications of SARS-CoV-2 infection: The COVID-CNS travelling heads study. PLOS ONE17, e0273704 (2022)
- 510(k) Premarket Notification. 510(k) Number vol. K210415 (2021).