
Stéphane ROCHE1, Samira MCHINDA1, Erwan SELINGUE2, Sébastien MÉRIAUX2, Ludovic de ROCHEFORT1.
- Ventio SAS, Marseille, France
- Paris-Saclay University, CEA, CNRS, NeuroSpin, UMR9027 BAOBAB, Gif-sur-Yvette, France
42nd annual meeting of the European Society for Magnetic Resonance in Medicine and Biology (ESMRMB), Sep 2026, Girona, Spain, Spain. ⟨hal-05783118⟩
Introduction: Alzheimer’s disease (AD) is characterised by progressive cognitive decline, and animal models provide a means of investigating disease mechanisms and evaluating therapeutic strategies1. Quantitative Susceptibility Mapping2 (QSM) is sensitive to iron accumulation and microstructural alterations relevant to AD pathology3. However, its application in preclinical studies remains limited by methodological challenges, which are exacerbated at ultra-high magnetic field and high spatial resolution. Many existing pipelines rely on explicit brain masking to stabilise dipole inversion4. While effective, such masking steps reduce reproducibility and can hinder the analysis of structures near tissue boundaries.
Here, we propose a robust framework designed to process gradient-echo data without requiring explicit masking, by fully exploiting both magnitude and phase information, providing qualitative and quantitative susceptibility contrasts in AD models.
Methods: Experiments were conducted on two AD transgenic murine models: a Fischer 344 Tg-AD5 rat line (one male animal aged 1 year and 7 months) and a C57BL/6 APP/PS16mouse line (one male animal aged 1 year and 8 months). MRI data were acquired post mortem on Bruker preclinical systems operating at 7T (rat) and 11.7T (mouse), using 3D multi-gradient echo (MGE) sequences, with acquisition parameters adapted to each model and field strength (Table 1).
Magnitude data were corrected to isolate (i) T2*-weighted contrast from T1 and bias field signals and (ii) anatomical contrast with attenuated CSF signals, while phase data were processed with a dedicated and robust strategy to provide whole-head Enhanced Susceptibility Maps (ESM). Phase unwrapping and background field removal were performed using a Laplacian-based approach7. Magnetic susceptibility maps were then estimated using a constrained optimisation (maximum likelihood) formulation with zeroth- and second-order derivative priors.
Results: The method demonstrates robustness and reproducibility across different MRI field strengths and species, providing standardised susceptibility imaging in preclinical settings. Based on a single multi-echo acquisition, it provides co-localized R2*, T2*-weighted (corrected from T1 and bias field), anatomical (with attenuated CSF signals), and ESM without the need for anatomical brain masking (Figure 1). These co-registered multi-contrast images allow precise analysis of key brain regions of interest, including the olfactory bulb, cortex, hippocampus, thalamus, and cerebellum. In addition, several myelinated fiber tracts were identifiable (Figure 3a, white arrow). In the rat model, iron accumulation was observed in the hippocampus, thalamus, and hypothalamus, with more subtle accumulations detected in the olfactory bulb (Figure 2). In the mouse model, iron accumulation appeared more localised in the hippocampus and the cortex (Figure 3). For both animals, the regions in which iron deposits are detected are consistent with the expected distribution of amyloid plaques for these types of AD model and the age of the scanned animals5,6.
Conclusion: The presented preclinical framework fully leverages multi-echo data by enabling whole-head enhanced susceptibility contrasts with multiple co-localised information (R2* map, T2*-weighted, anatomical images, and whole-head ESM), without the need for anatomical brain masking. Applied to two well-established transgenic Alzheimer’s disease models – the Tg-AD rat and the APP/PS1 mouse – this framework demonstrates its ability to detect the localised paramagnetic accumulations in the murine brain. These results highlight its relevance and potential value for preclinical trials evaluating innovative therapeutic strategies for Alzheimer’s disease.
Data and Code Availability Statement:
The associated code implements a proprietary methodology that is currently the subject of a pending patent application.
This project was funded by the “Sud” region and by the government as part of the France 2030 investments for the future plan.
References
1. Ni R. Magnetic Resonance Imaging in Animal Models of Alzheimer’s Disease Amyloidosis. Int J Mol Sci. 2021;22(23):12768. doi:10.3390/ijms222312768
2. De Rochefort L, Liu T, Kressler B, et al. Quantitative susceptibility map reconstruction from MR phase data using bayesian regularization: Validation and application to brain imaging. Magn Reson Med. 2010;63(1):194-206. doi:10.1002/mrm.22187
3. Cogswell PM, Wiste HJ, Senjem ML, et al. Associations of quantitative susceptibility mapping with Alzheimer’s disease clinical and imaging markers. NeuroImage. 2021;224:117433. doi:10.1016/j.neuroimage.2020.117433
4. Wei H, Xie L, Dibb R, et al. Imaging whole-brain cytoarchitecture of mouse with MRI-based quantitative susceptibility mapping. NeuroImage. 2016;137:107-115. doi:10.1016/j.neuroimage.2016.05.033
5. Cohen RM, Rezai-Zadeh K, Weitz TM, et al. A Transgenic Alzheimer Rat with Plaques, Tau Pathology, Behavioral Impairment, Oligomeric Aβ, and Frank Neuronal Loss. J Neurosci. 2013;33(15):6245-6256. doi:10.1523/JNEUROSCI.3672-12.2013
6. Jankowsky JL, Fadale DJ, Anderson J, et al. Mutant presenilins specifically elevate the levels of the 42 residue β-amyloid peptide in vivo: evidence for augmentation of a 42-specific γ secretase. Hum Mol Genet. 2004;13(2):159-170. doi:10.1093/hmg/ddh019
7. De Rochefort L. Quantitative Susceptibility Mapping in Vivo in the Rat Brain. In: 2010.
| Animal | Disease model | Magnetic Field | Echo train length | TR | TE1 | Last TE | Flip Angle | Resolution (isotropic) | Acquisition Time |
| Mouse | APP/PS1 | 11.7T | 8 | 90ms | 4ms | 43.6ms | 17° | 40 µm | 12h10 |
| Rat | TgF344-AD | 7T | 13 | 90ms | 3.5ms | 59.3ms | 17° | 90 µm | 21h20 |
Table 1: Characteristics of MGE acquisitions.
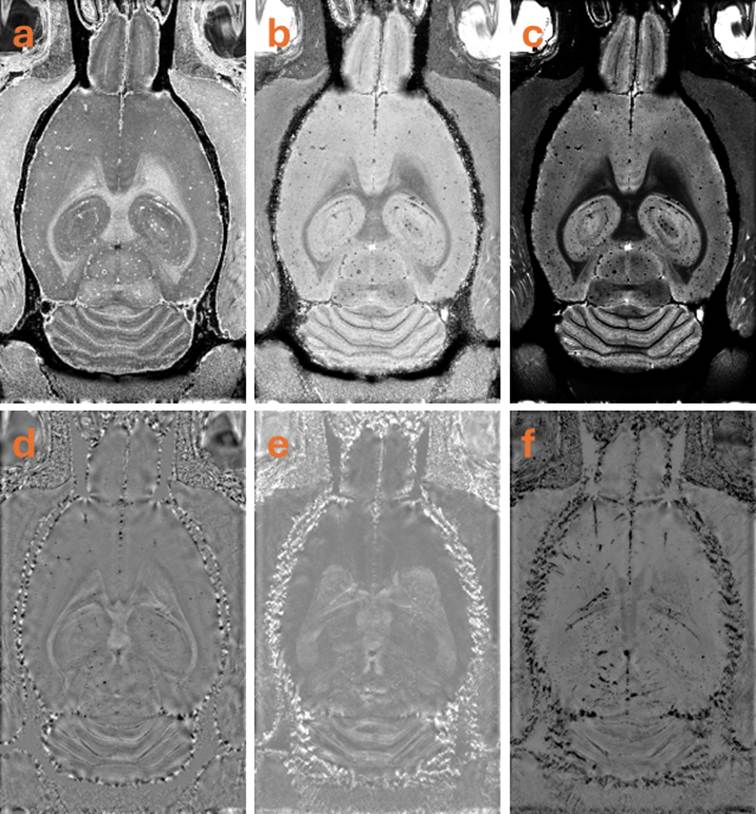
Figure 1: Generation of colocalised multimodal images obtained of the TgF344-AD rat brain at 7T including R2* (a), T2*w (corrected from T1 and bias field) (b), anatomical with attenuated CSF signals (c), whole-head enhanced susceptibility mapping (ESM, d), Maximum (e) and minimum (f) intensity projection over 1.2 mm, giving access to robust tissue characterisation. The chosen convention is to represent diamagnetic in white (-50 parts-per-billion) and paramagnetic in black (+50 parts-per-billion). The colocalisation of multiple MRI contrasts enables a comprehensive and integrated depiction of tissue properties and anatomical features.
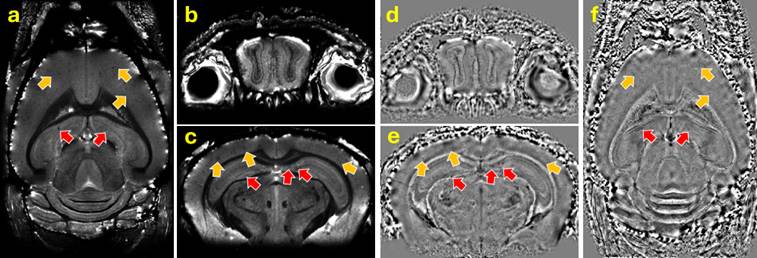
Figure 2: Selected views of the TgF344-AD rat brain at 7T: T2*w (a, b, c) and ESM (d, e, f), shown in axial (a,f) and coronal (b-e) planes, exemplifying the detection of iron accumulation in regions of interest expected for this animal model and age (olfactory bulb, hippocampus, cortex, striatum). Orange arrows indicate thalamic and hypothalamic lesions; red arrows indicate hippocampal lesions; purple arrows denote olfactory bulb lesions.
Figure 3: Selected views of the APP/PS1 mouse brain at 11.7T: anatomical CSF attenuated contrast (a, b, c) and ESM (d, e, f), shown in transverse (a,f) and coronal (b-e) planes, exemplifying the detection of iron accumulation in regions of interest expected for this animal model and age (hippocampus and cortex). Orange arrows indicate cortical lesions and red arrows indicate hippocampal lesions. No lesion has been confirmed in the olfactory bulb.